import numpy as np
import matplotlib.pyplot as plt

def brake_pulse(t):
    """The leader brakes at 1 m/s² for 2 s, then accelerates back for 2 s."""
return -1.0 if t < 2 else (1.0 if t < 4 else 0.0)Lab 2 · Phantom Jams on Your Laptop
Reproduce the 1959 GM experiment · local and string stability · when a platoon collides
 Run this lab in your browser, with nothing to install.
In 1959, four researchers at General Motors (Herman, Montroll, Potts and Rothery) asked a simple question: if every driver just tries to match the speed of the car ahead, after a short reaction time, is traffic stable? Their answer explained phantom jams sixty years before anyone filmed one on a ring road.
In this lab you will rebuild their experiment from scratch:
- Simulate a line of cars with a reaction delay.
- Find the thresholds where one driver, and then a whole line of drivers, becomes unstable.
- Discover when a platoon crashes, even though no single driver does anything unreasonable.
1 · The model
Car n+1 follows car n. After a reaction time T, the follower accelerates in proportion to the speed difference:
\ddot x_{n+1}(t) = \lambda\,\big[\dot x_n(t-T) - \dot x_{n+1}(t-T)\big].
Everything depends on C = \lambda T. We track u_n(t), each car’s speed change from cruising speed, and step forward in time with Euler’s method, u(t+\Delta t) = u(t) + a\,\Delta t. The delay means the acceleration now uses speeds from T seconds ago.
Your turn. Complete simulate below.
def simulate(C, n_cars=8, T=1.0, dt=0.01, t_end=50.0, leader_accel=brake_pulse):
    """Speed change of each car behind a leader, for the 1959 GM model.

    Returns (t, u): t has shape (steps + 1,), and u has shape (n_cars + 1, steps + 1).
    Row 0 of u is the leader; row n is the n-th follower. All speed changes start at 0.

    The follower's acceleration at step k uses speeds from `lag = round(T / dt)` steps earlier:
        a_n = (C / T) * (u[n-1, k-1-lag] - u[n, k-1-lag])     (and 0 while k-1-lag < 0)
    """
    lam = C / T
    lag = round(T / dt)
    steps = round(t_end / dt)
    t = np.arange(steps + 1) * dt
    u = np.zeros((n_cars + 1, steps + 1))
    # YOUR CODE HERE: step through time with Euler's method.
    # At each step: update the leader from leader_accel(t), then each follower from the delayed speeds.
    return None
2 · One follower: local stability
Start with just one car behind the leader, and try five values of C.
Cs = [0.3, 1 / np.e, 1.0, np.pi / 2, 1.7]
fig, axes = plt.subplots(1, len(Cs), figsize=(16, 3), sharey=True)
for ax, C in zip(axes, Cs):
    result = simulate(C, n_cars=1, t_end=40)
    if result is None:
        ax.text(0.5, 0.5, "complete simulate()", ha="center", transform=ax.transAxes)
    else:
        t, u = result
        ax.plot(t, u[0], "k--", lw=1, label="leader")
        ax.plot(t, u[1], color="#57068c", lw=2, label="follower")
    ax.set_title(f"C = {C:.3f}")
    ax.set_xlabel("Time (s)")
    ax.set_ylim(-4, 4)
axes[0].set_ylabel("Speed change (m/s)")
if result is not None:
    axes[0].legend()
plt.tight_layout()
Question 1. Describe the follower’s response in each panel. Herman and his colleagues proved that the response is smooth for C \le 1/e, oscillates but settles for 1/e < C < \pi/2, and grows for C > \pi/2. Do your plots agree?
3 · A line of cars: string stability
Now put 8 cars behind the leader. A disturbance can fade or grow as it passes back down the line. We measure the amplification: the largest speed change of the last car, divided by that of the first follower.
def amplification(C, n_cars=8):
    result = simulate(C, n_cars=n_cars, t_end=60)
    if result is None:
        return np.nan
    _, u = result
    peak = np.abs(u).max(axis=1)
    return peak[-1] / peak[1]

Cs = np.linspace(0.2, 1.0, 41)
amp = [amplification(C) for C in Cs]
plt.figure(figsize=(8, 4))
plt.semilogy(Cs, amp, "o-", color="#57068c")
plt.axhline(1, color="gray", ls="--")
plt.axvline(0.5, color="red", ls=":", label="C = 1/2 (theory)")
plt.xlabel("C = λT")
plt.ylabel("Amplification (last / first)")
plt.legend()
plt.grid(True, which="both", alpha=0.3)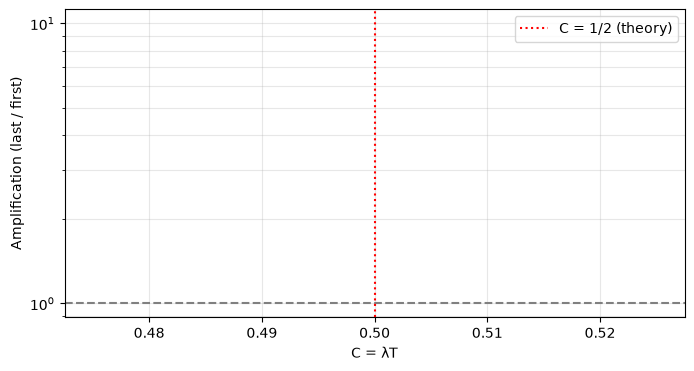
Question 2. Theory says a long line of cars is stable only when C < 1/2. At what C does your amplification cross 1? It is not exactly 1/2. Give two reasons why. (Hint: how many cars are there, and how long does the leader brake?)
Question 3. Try n_cars=20. Does the crossing move towards 1/2?
4 · When does a platoon crash?
Speed changes are one thing; collisions are another. Give every car a real position: 20 m/s cruising, 15 m from bumper to bumper, 5 m long.
Your turn. Complete first_collision below.
def first_collision(C, n_cars=9, spacing=15.0, speed=20.0, car_length=5.0, **kw):
    """Time (s) of the first collision in the platoon, or None if nobody collides.

    Every car starts at `speed` m/s with `spacing` metres from front bumper to front bumper.
    Hint: position = initial position + integral of (speed + u) dt. A collision happens when
    the gap to the car ahead, minus car_length, reaches 0.
    """
    # YOUR CODE HERE
    return "not implemented"
for C in [0.4, 0.6, 0.8, 1.0]:
hit = first_collision(C)
if hit == "not implemented":
print("Complete first_collision() above")
break
print(f"C = {C:.1f}: " + ("no collision" if hit is None else f"first collision at t = {hit:.2f} s"))Complete first_collision() aboveQuestion 4. Every driver in this platoon follows a perfectly sensible rule. Who is to blame for the collision? What does this tell you about designing automated vehicles?
Going further
- Faster reactions. Keep \lambda fixed and halve T. What happens to C, and to the collision?
- One automated car. Make car 4 react with C = 0.3 while the others keep C = 0.8. Does one careful driver protect the cars behind it?
- Back to the ring. The ring road in Lecture 1 used a different model (IDM). Why did raising driver attentiveness dissolve its jam?